Try Weglot for free


Launching a multilingual website is easy*. Knowing whether it’s actually driving visibility, traffic, and revenue? That’s harder than many marketers expect.
GA4 and Google Search Console – the analytics tools most teams know best – weren’t really designed for multilingual reporting. A flat-looking “organic traffic” line can easily hide the fact that one language version doubled while another quietly collapsed, for instance.
AI search has also introduced another layer that many teams aren’t measuring yet: generative engine optimization, or GEO.
Here’s a practical, three-tier framework for measuring multilingual SEO and GEO performance: what to check, where to find it, and what each metric is really telling you.
(*with Weglot)
A site can rank brilliantly in one language and be invisible in another, often because of a quiet technical issue no one noticed at launch. Foundation metrics catch that kind of issue.
Here are the 4 big ones to track, primarily available in Google Search Console (GSC).
Are your French pages actually in Google’s index? Your German pages? Your Spanish ones?
In GSC, the Page indexing report shows how many URLs are live in search results – like so:
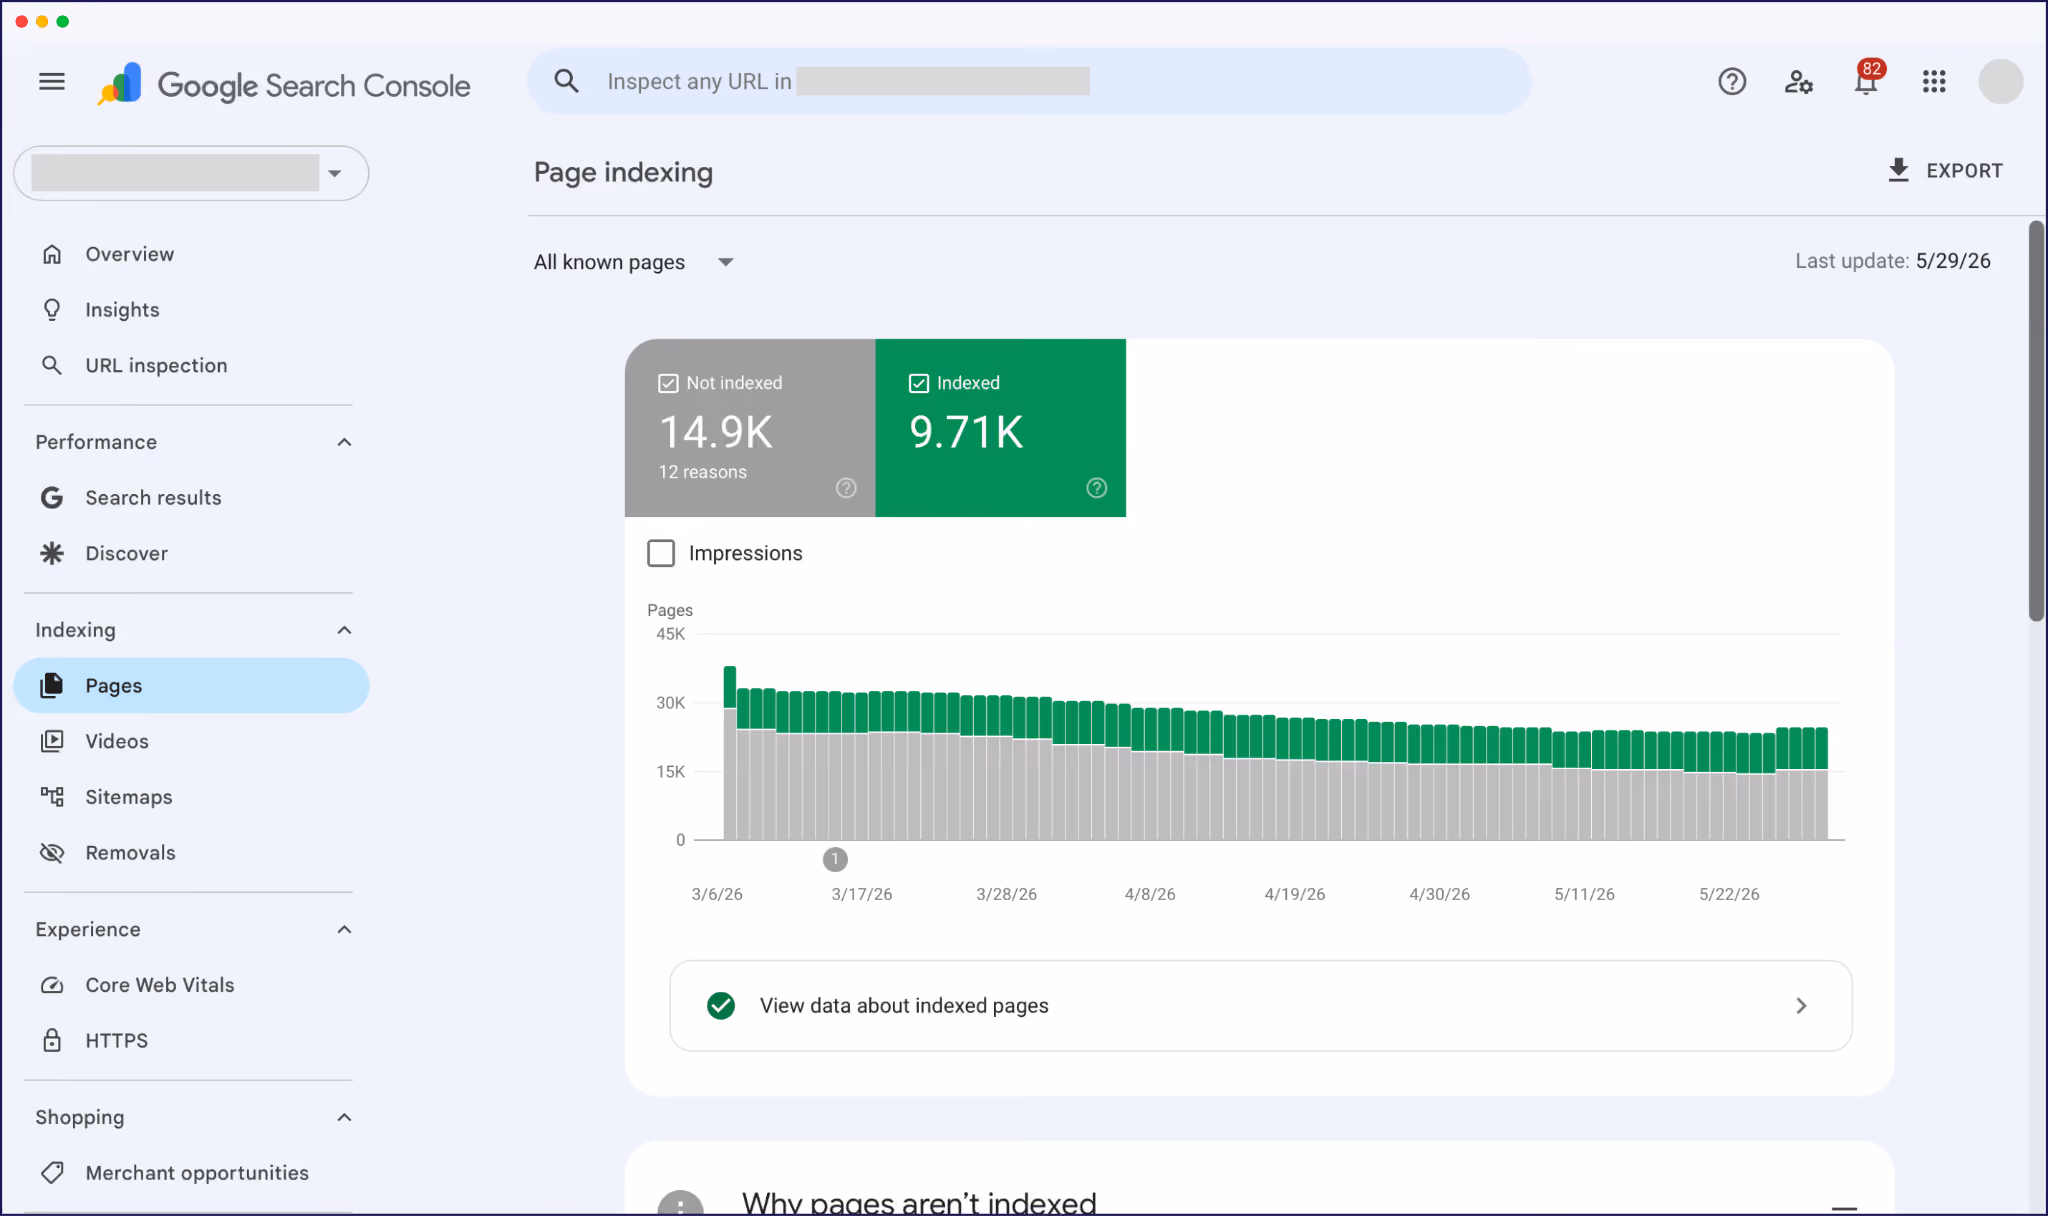
There are two ways to drill down into this data for multilingual sites:
Either way, the report highlights issues. If you’ve launched 200 French pages but only 60 are indexed, for instance, you’ll quickly spot a visibility problem that the rest of your dashboard can’t see.
Common indexing obstacles include broken sitemap entries, missing hreflang implementation, and robots.txt blocks.
Hreflang tags tell Google “this French page is for French speakers, this English page is for English speakers, and they’re equivalents of each other”.
Without these tags, or if they aren’t set up correctly, Google can guess wrong and serve the wrong language to the wrong user.
To audit, enter a localized URL in GSC’s URL Inspection tool. This shows whether Google has correctly processed your hreflang tags and identified the correct return tags.
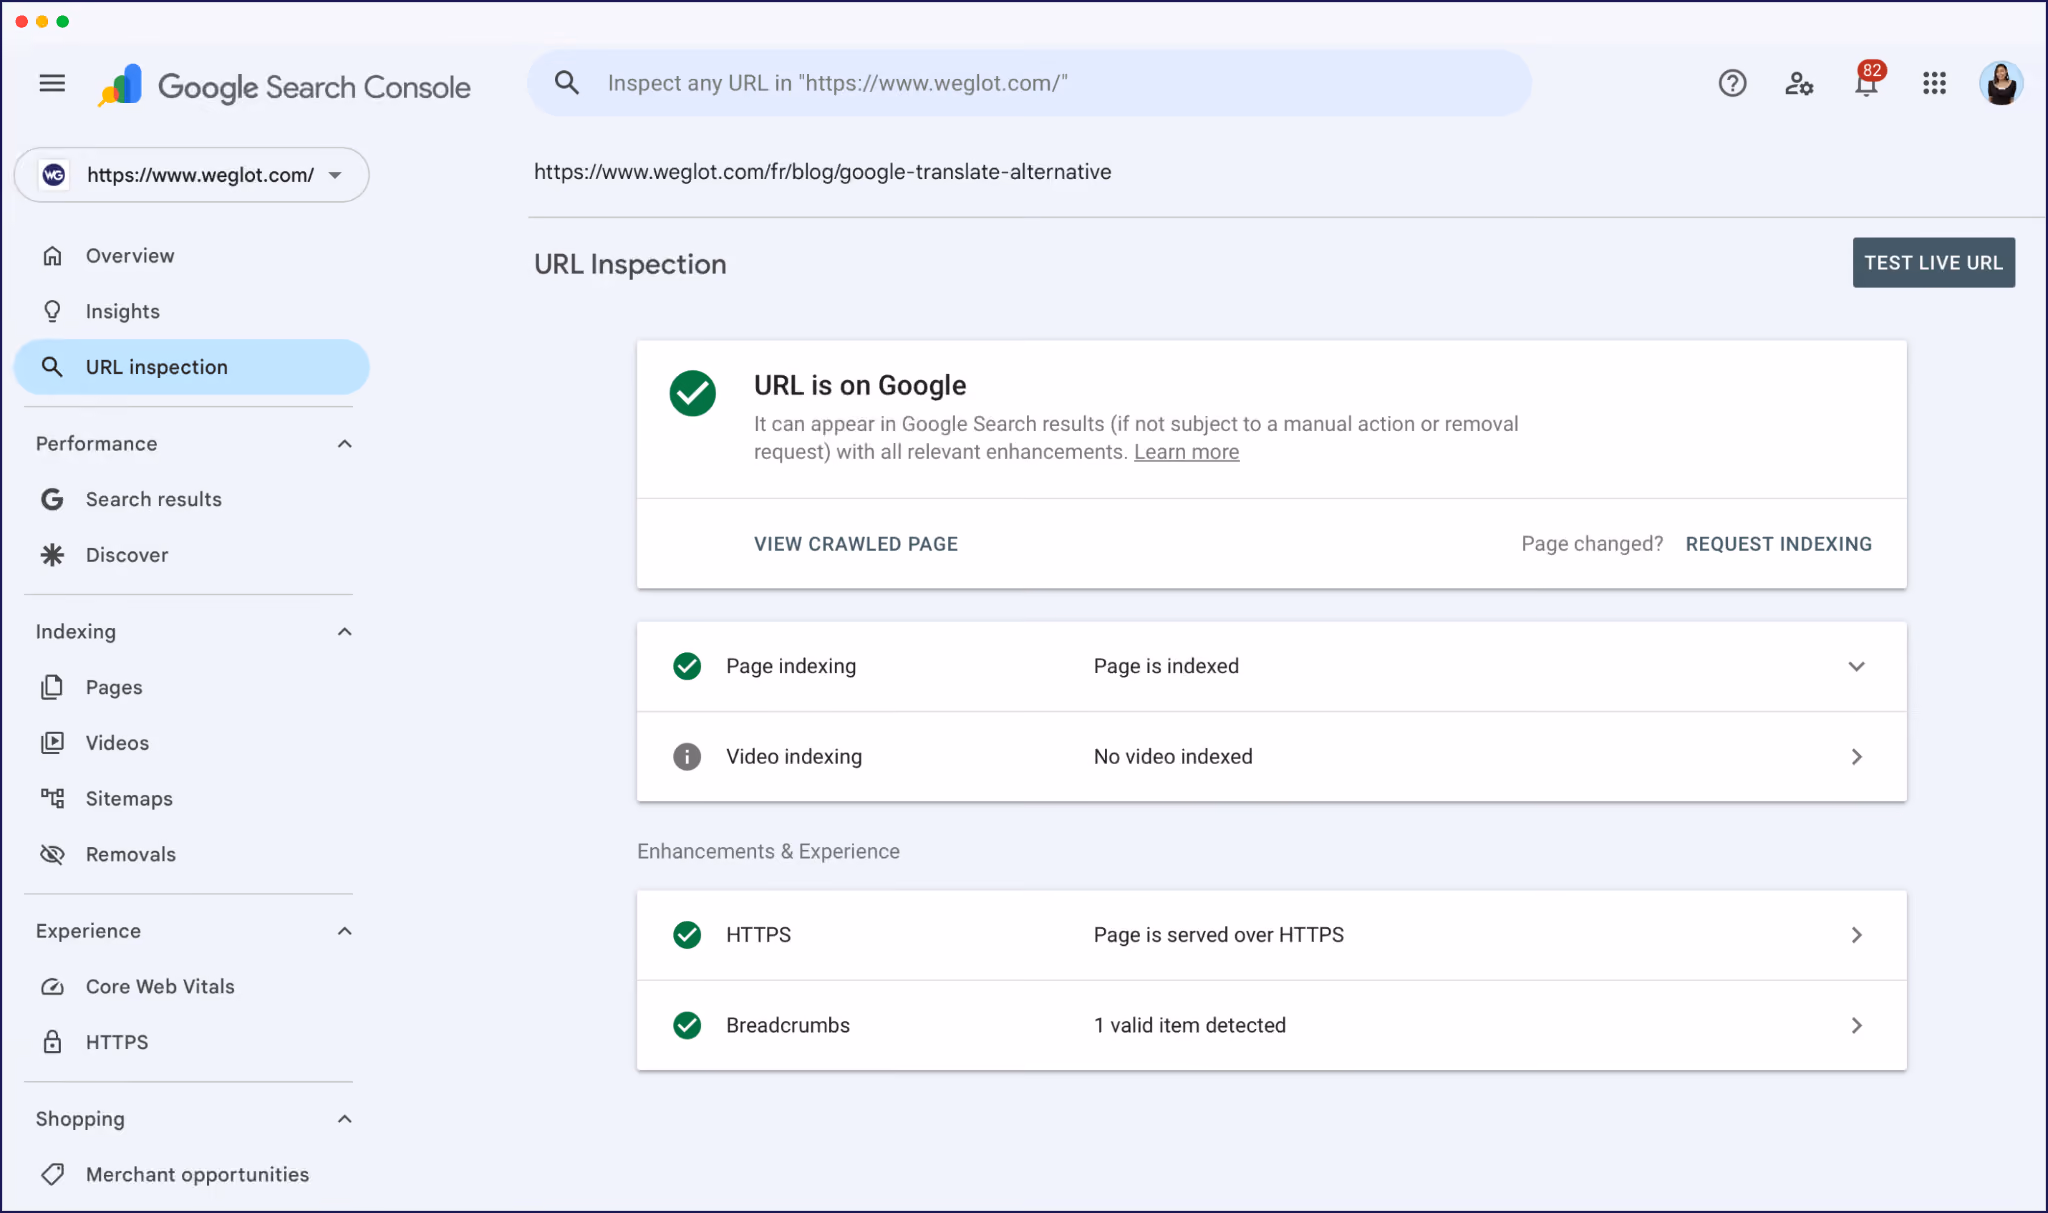
The most common error here is “no return tags” – i.e., your French page points to English, but English doesn’t point back. Both sides need to reference each other for hreflang to work.
This one surprises people. You’d assume a translated version of a page loads at the same speed as the source. It often doesn’t.
Translation can add page weight (longer strings, additional script calls), and some setups serve translated pages from a different infrastructure entirely.
Check the Core Web Vitals report in GSC. You’ll see a broader picture of performance first, with issues flagged in red, and you can also dig deeper to look at performance by URL path.
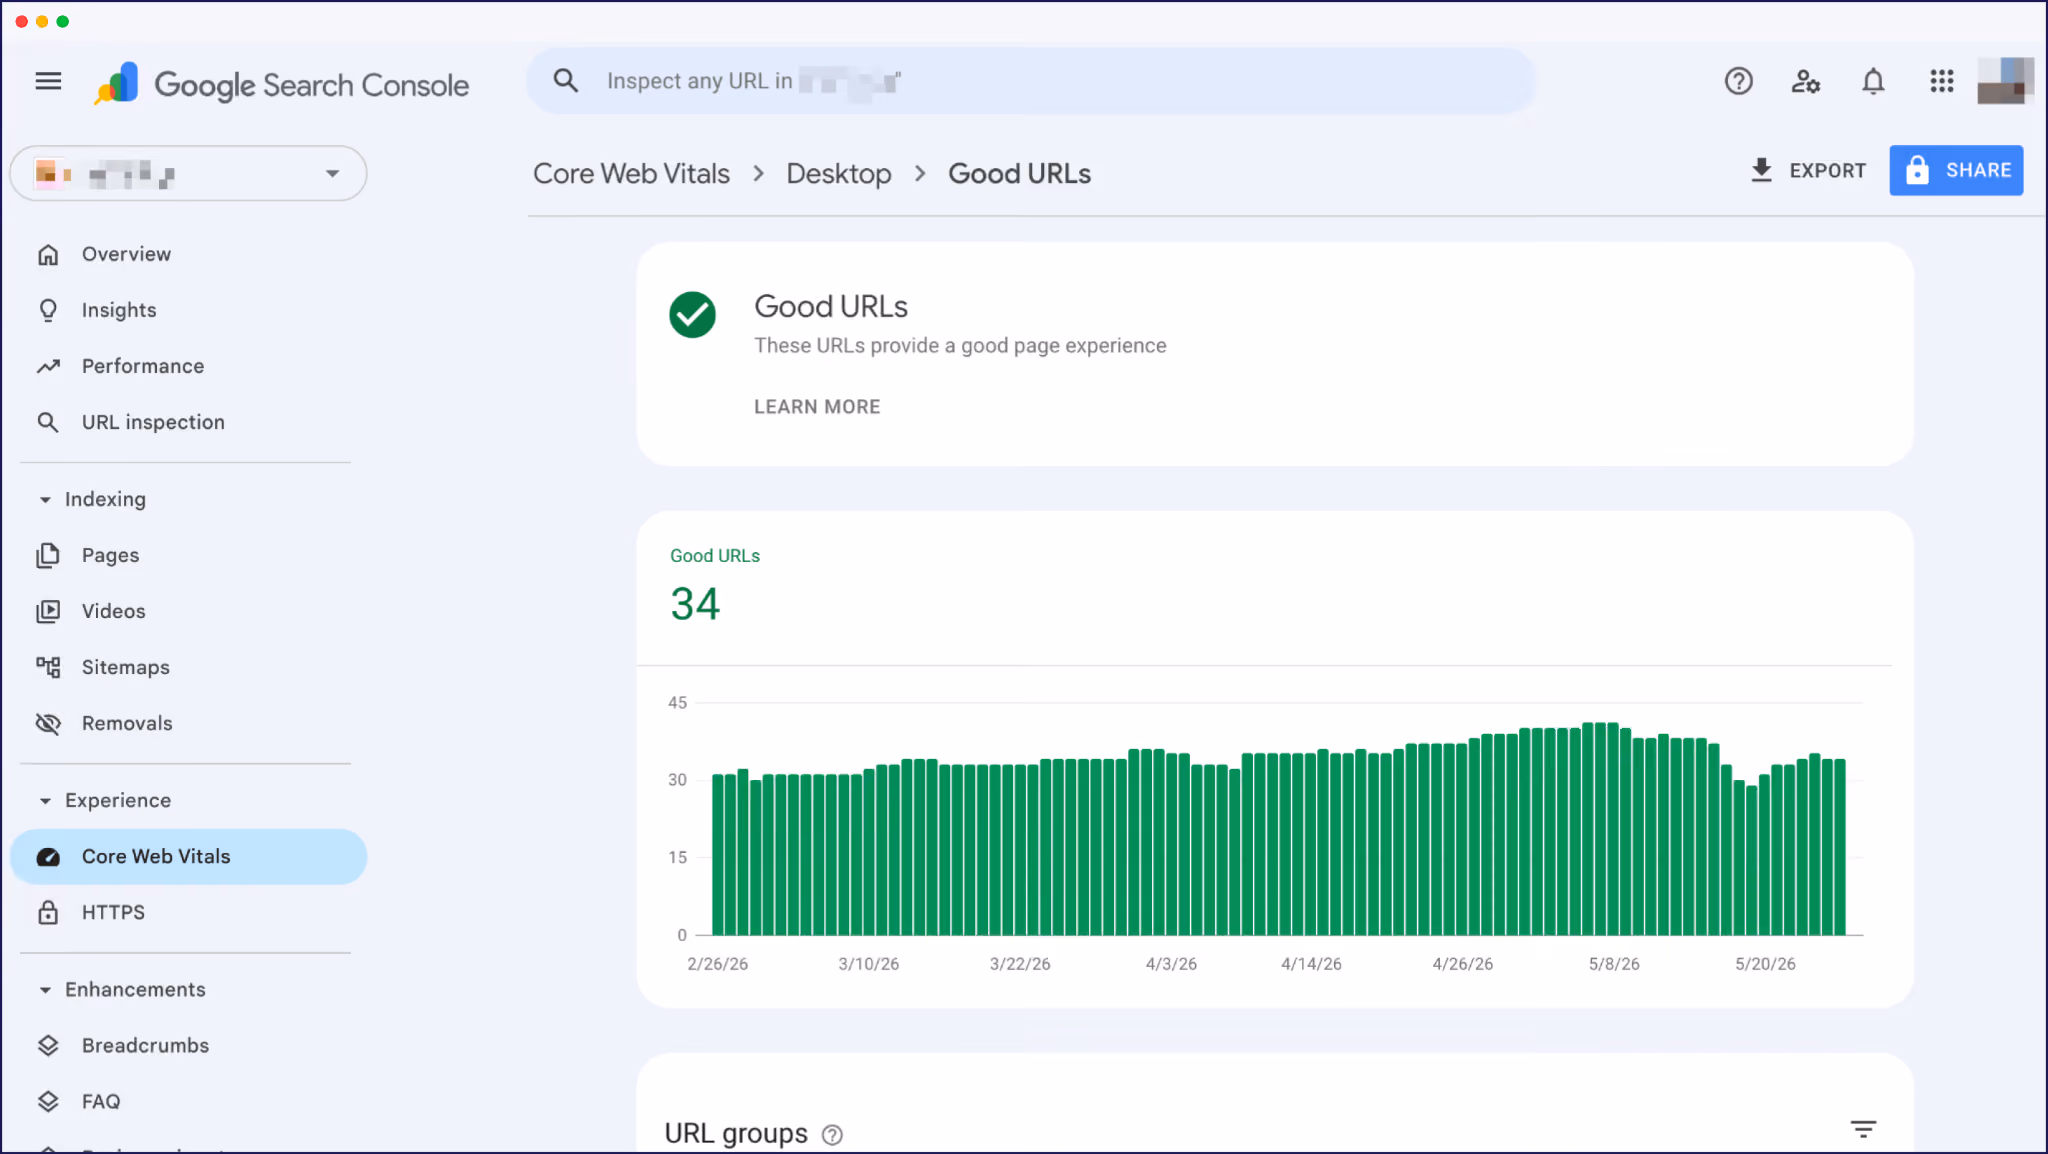
Keep an eye on INP (Interaction to Next Paint) in particular: if /de/ consistently lags behind /en/, that’s a ranking signal Google notices and something to address.
Mobile usage varies dramatically by country, and in many emerging markets it dominates web traffic (e.g., almost 70% in India). Translation and layout issues often surface there first.
Multilingual sites are especially vulnerable because translated text rarely expands evenly. Navigation wraps differently, buttons shift, and layouts designed around one language can break surprisingly quickly on smaller screens.
GSC’s Core Web Vitals dashboard catches the most obvious technical issues for mobile displays as well as desktops. You can check the mobile performance of any localized URL in PageSpeed Insights, too:
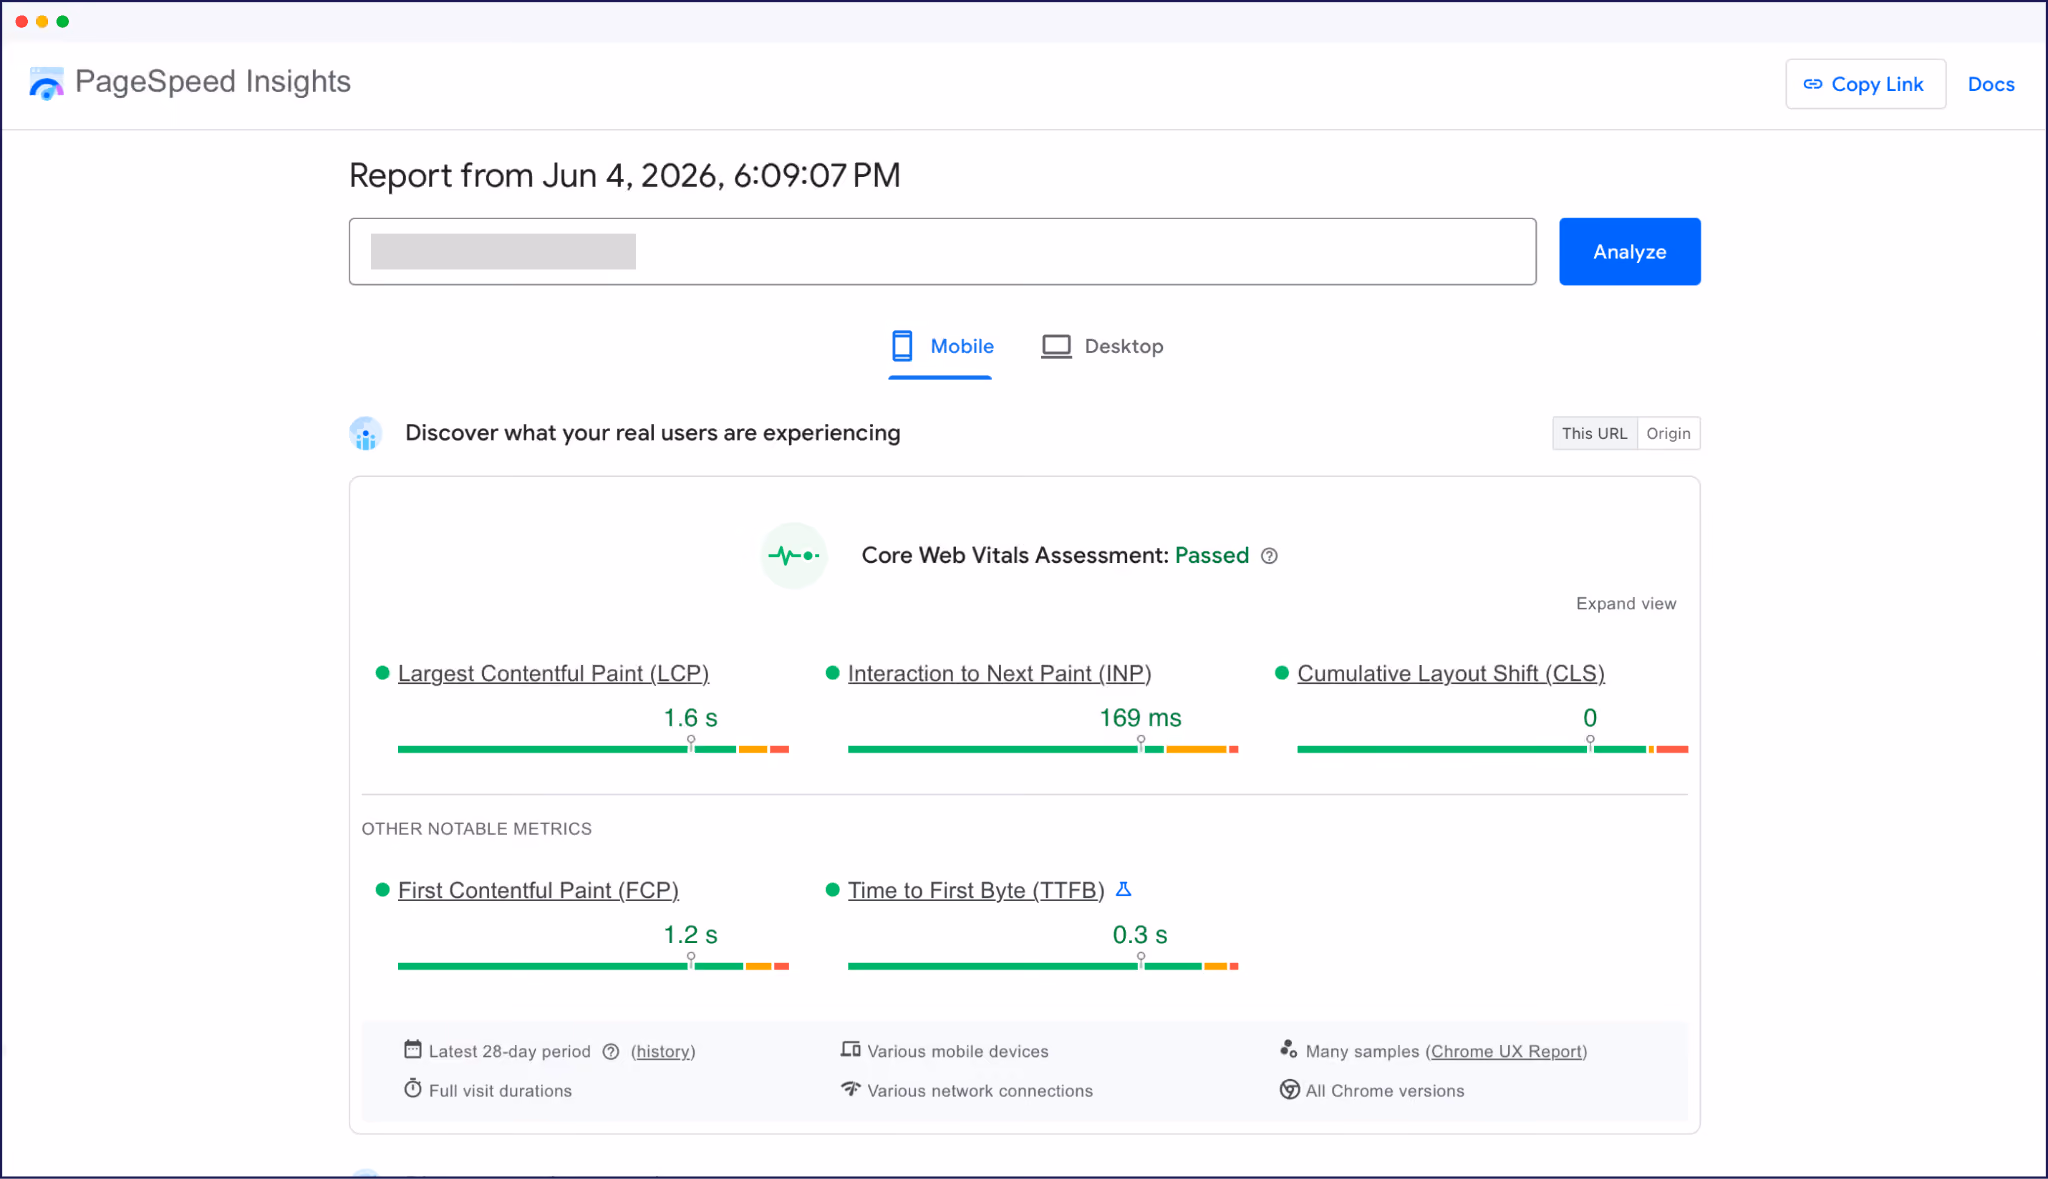
Pair these with a manual check for multilingual UX problems automated reports won’t catch. In other words, pull up your translated pages on a phone and pretend you’re a customer!
Almost every Tier 1 issue traces back to how a site was translated and structured.
And nobody usually notices any of it until traffic underperforms.
This is the unglamorous prerequisite for everything else: a clean, indexable, properly structured multilingual setup.
Weglot handles this layer automatically, adding hreflang tags, generating language-specific subdirectory URLs (like /fr/) or subdomains, translating metadata, and syncing it all as your source site evolves.
Tier 2 is the diagnostic core, where metrics tell you whether your localization investment is paying off, market by market.
These metrics are also the ones most likely to get misread on a multilingual site, because the defaults in GA4 and GSC hide what you need to see.
Here are the 5 to make sure you track, most in GA4 (Google Analytics).
Country and language often get treated as the same metric. They aren’t.
Think of it this way: a French speaker in Belgium browsing your /fr/ pages is a different signal from a French speaker in Belgium reaching your English homepage by accident.
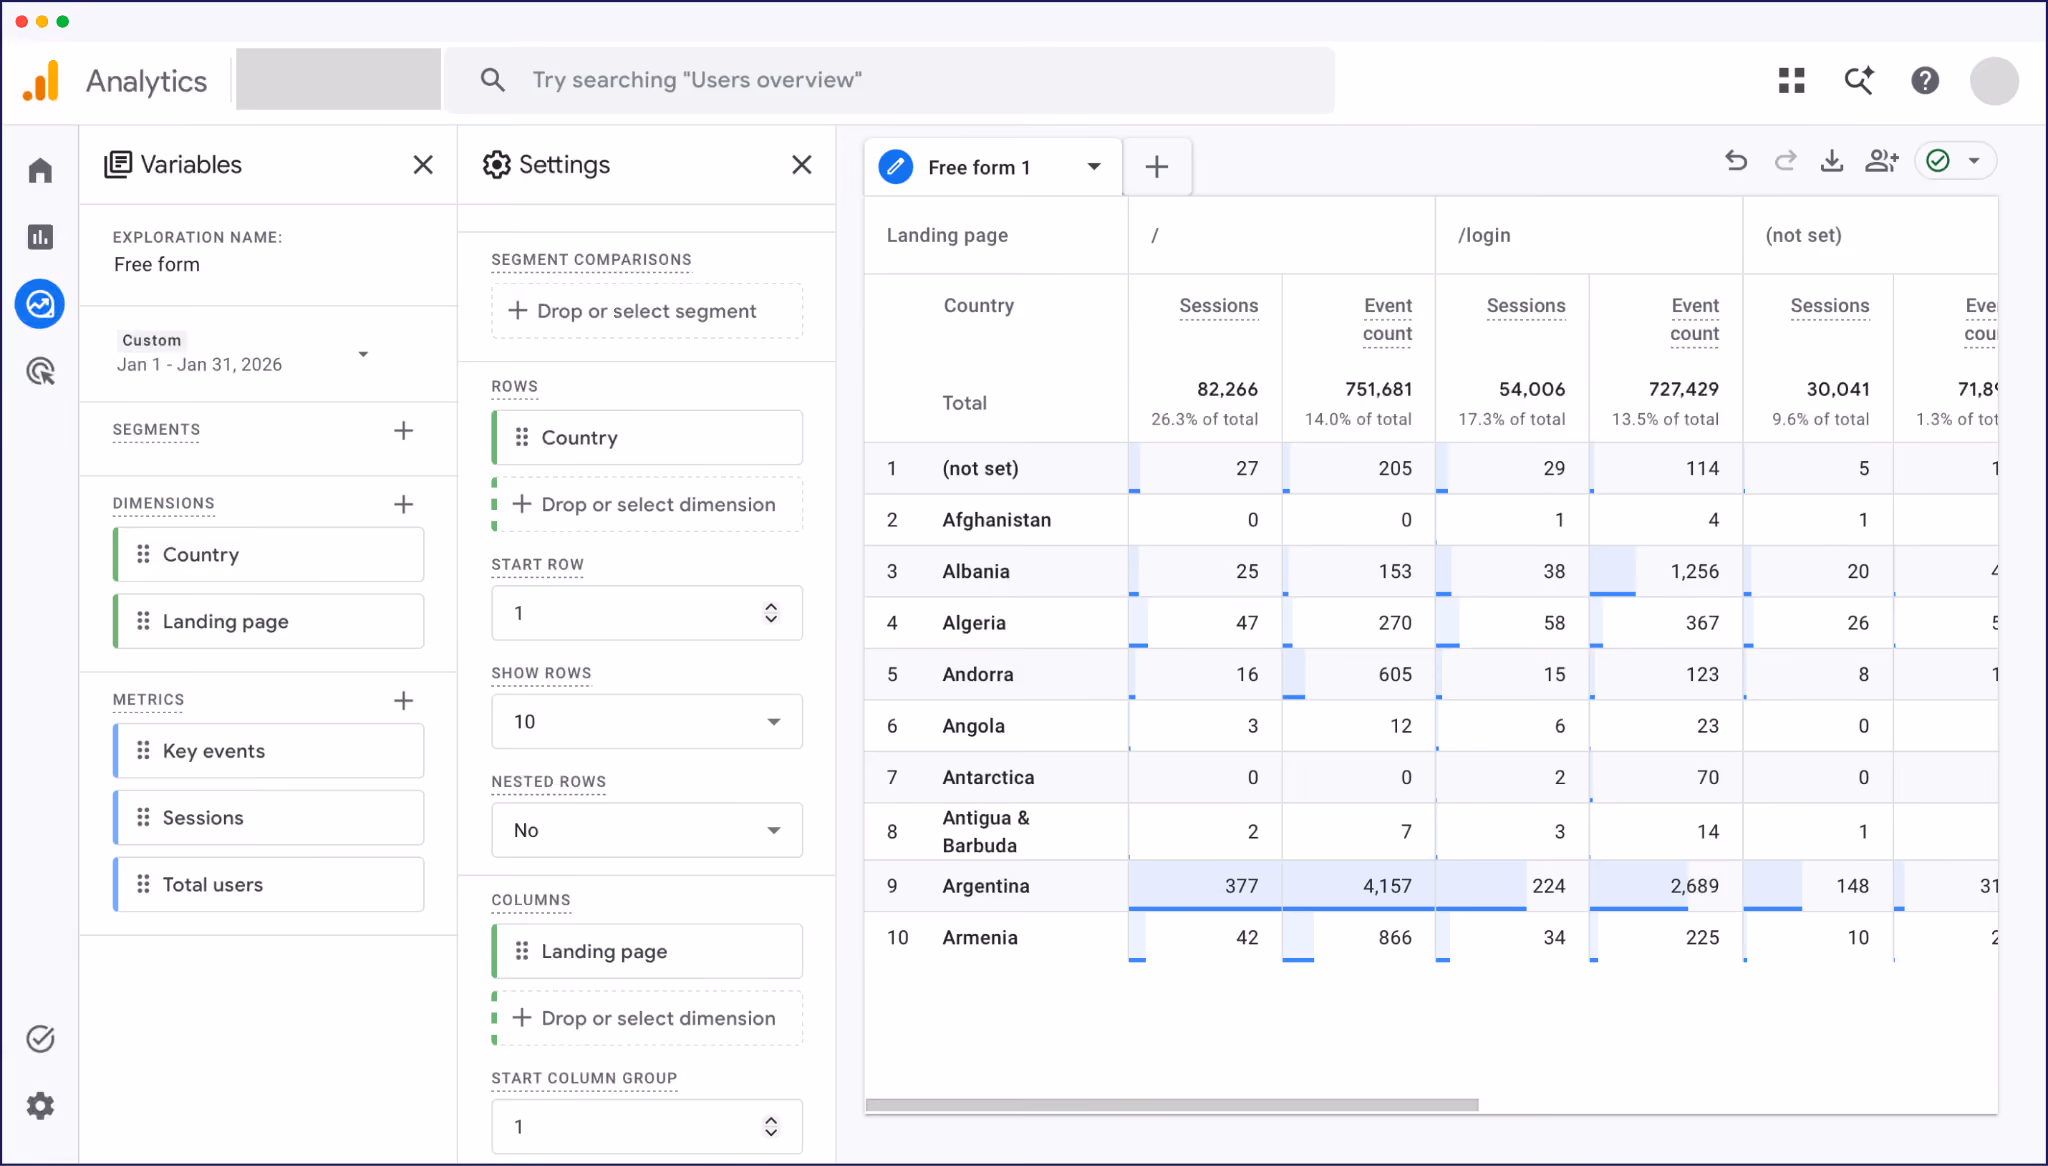
In GA4, build a Free form exploration with Country as one dimension and Landing page as another (filtered by path, like /fr/). That lets you compare where visitors are located against which language version they actually landed on.
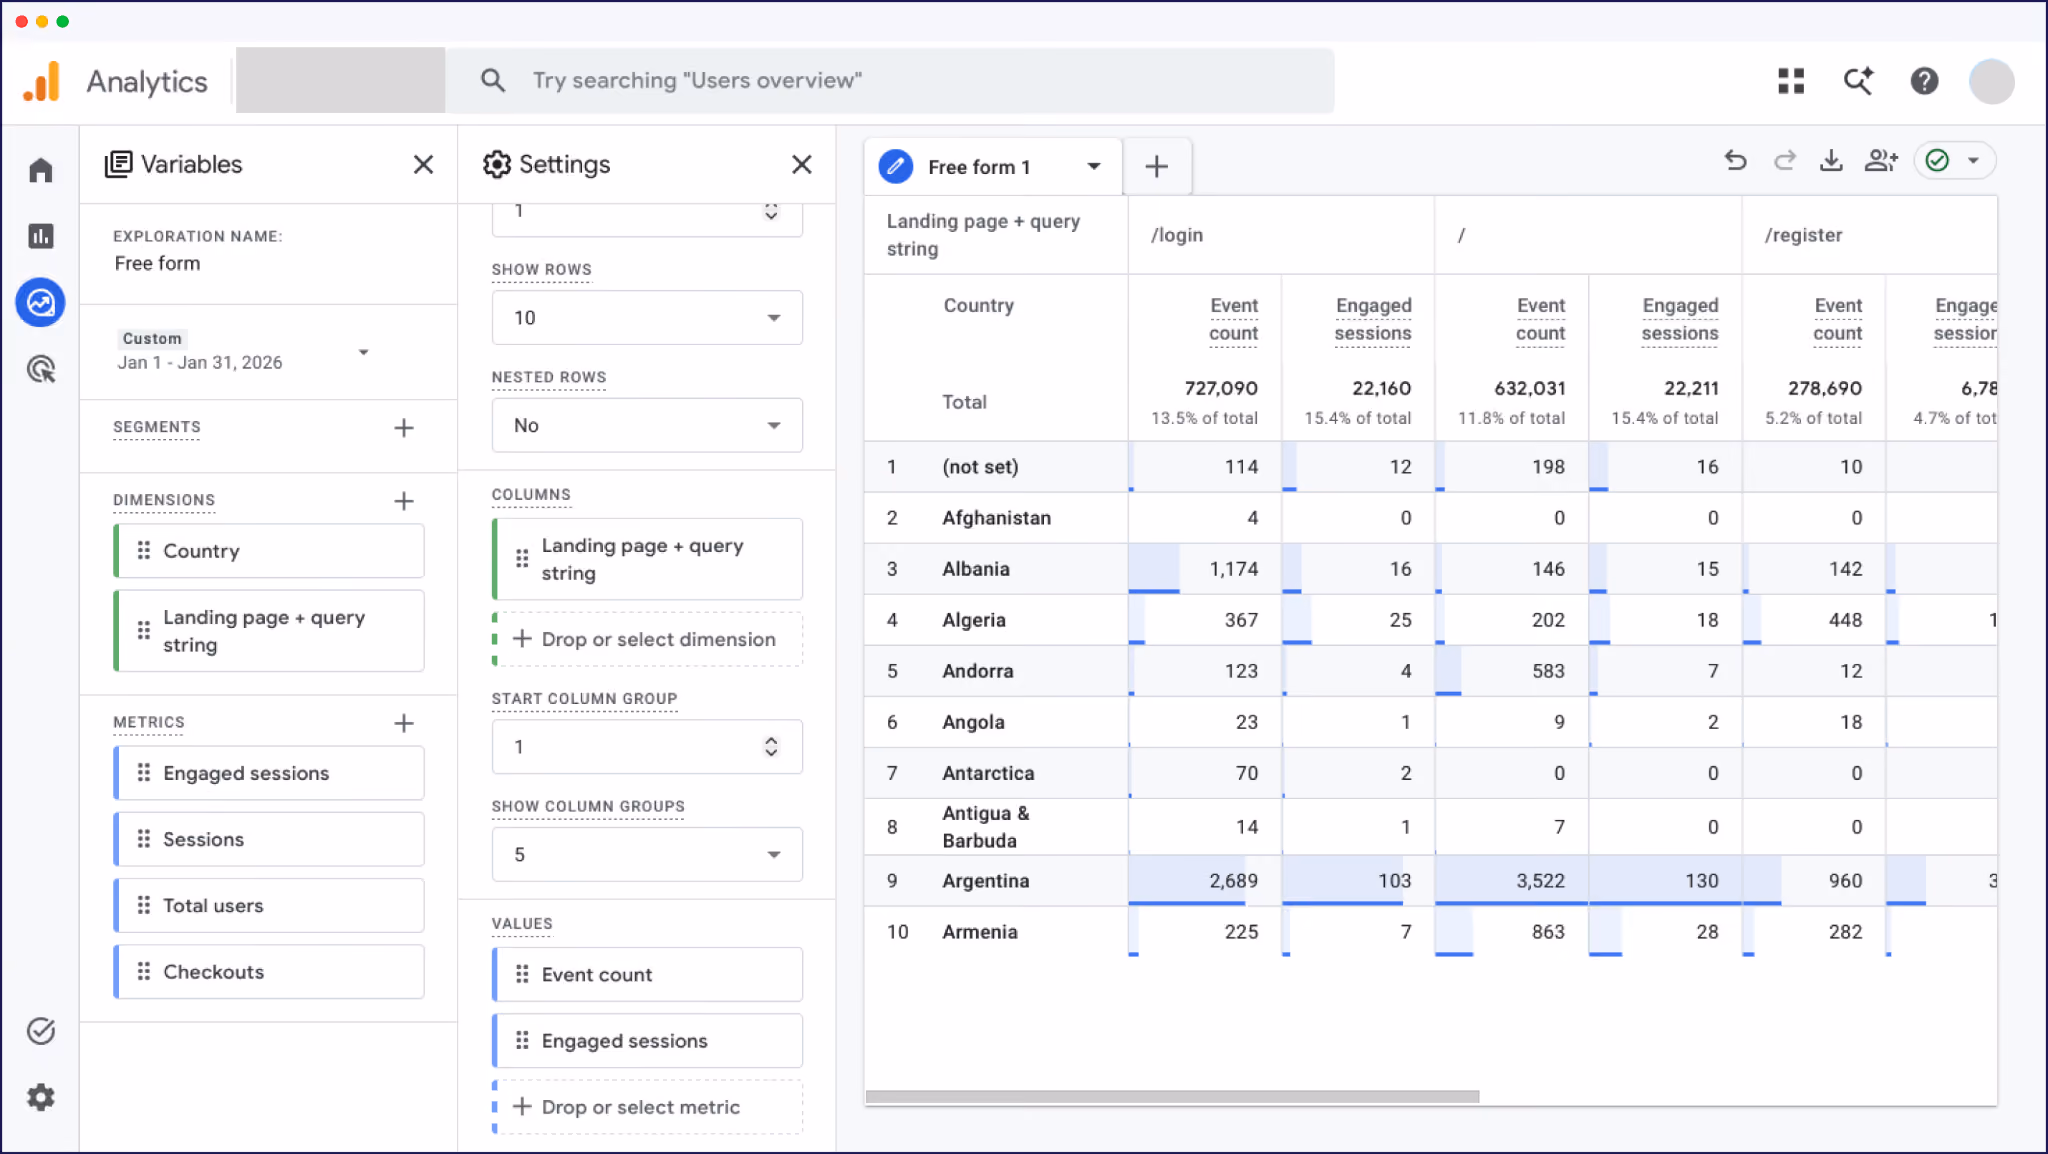
If the numbers diverge sharply – say, lots of French-language traffic from outside France – it could show demand exists outside your original target market. Worth flagging for your next strategy review.
Ranking data tells you whether your translated content is competing for the queries that matter in each market.
Many teams use third-party tools like Ahrefs or Semrush for rank tracking because GSC only shows keywords where your site is already appearing in search results.
Even then, “average position” can be misleading on multilingual sites because GSC averages every market together by default. A keyword ranking #3 in French and #45 in German averages to #24 – a number that describes neither reality.
For an accurate read, always segment by country in your rank tracker, or filter GSC’s Performance report by Country and URL path before reading the position column.
Conversion rate by region is one of the most undertracked multilingual SEO metrics, even though it’s such a helpful signal.
For example, if your French version pulls 30% more traffic than your German version but converts at half the rate, that usually signals localization issues more than a traffic problem.
The translated checkout may have a broken field. Maybe the offer doesn’t resonate. Or perhaps pricing isn’t shown in the right currency. Either way, you know there’s friction to address.
In GA4, set up conversion events (Key events) for actions like sign-ups, purchases, or demo bookings, then segment by Country and language-specific Landing page paths.
Track conversion rate, not just volume. Volume tracks traffic, rate tracks market fit.
Time on page, pages per session, and scroll depth tell you whether translated content is being read or just landed on.
But bounce rate alone can be misleading on translated sites. Someone who lands on a translated page, finds exactly what they want, and quickly leaves can look identical to a user who bounced because the translation was unreadable.
Use GA4’s Engaged sessions metric instead (sessions over 10 seconds, with a conversion, or with 2+ pageviews).
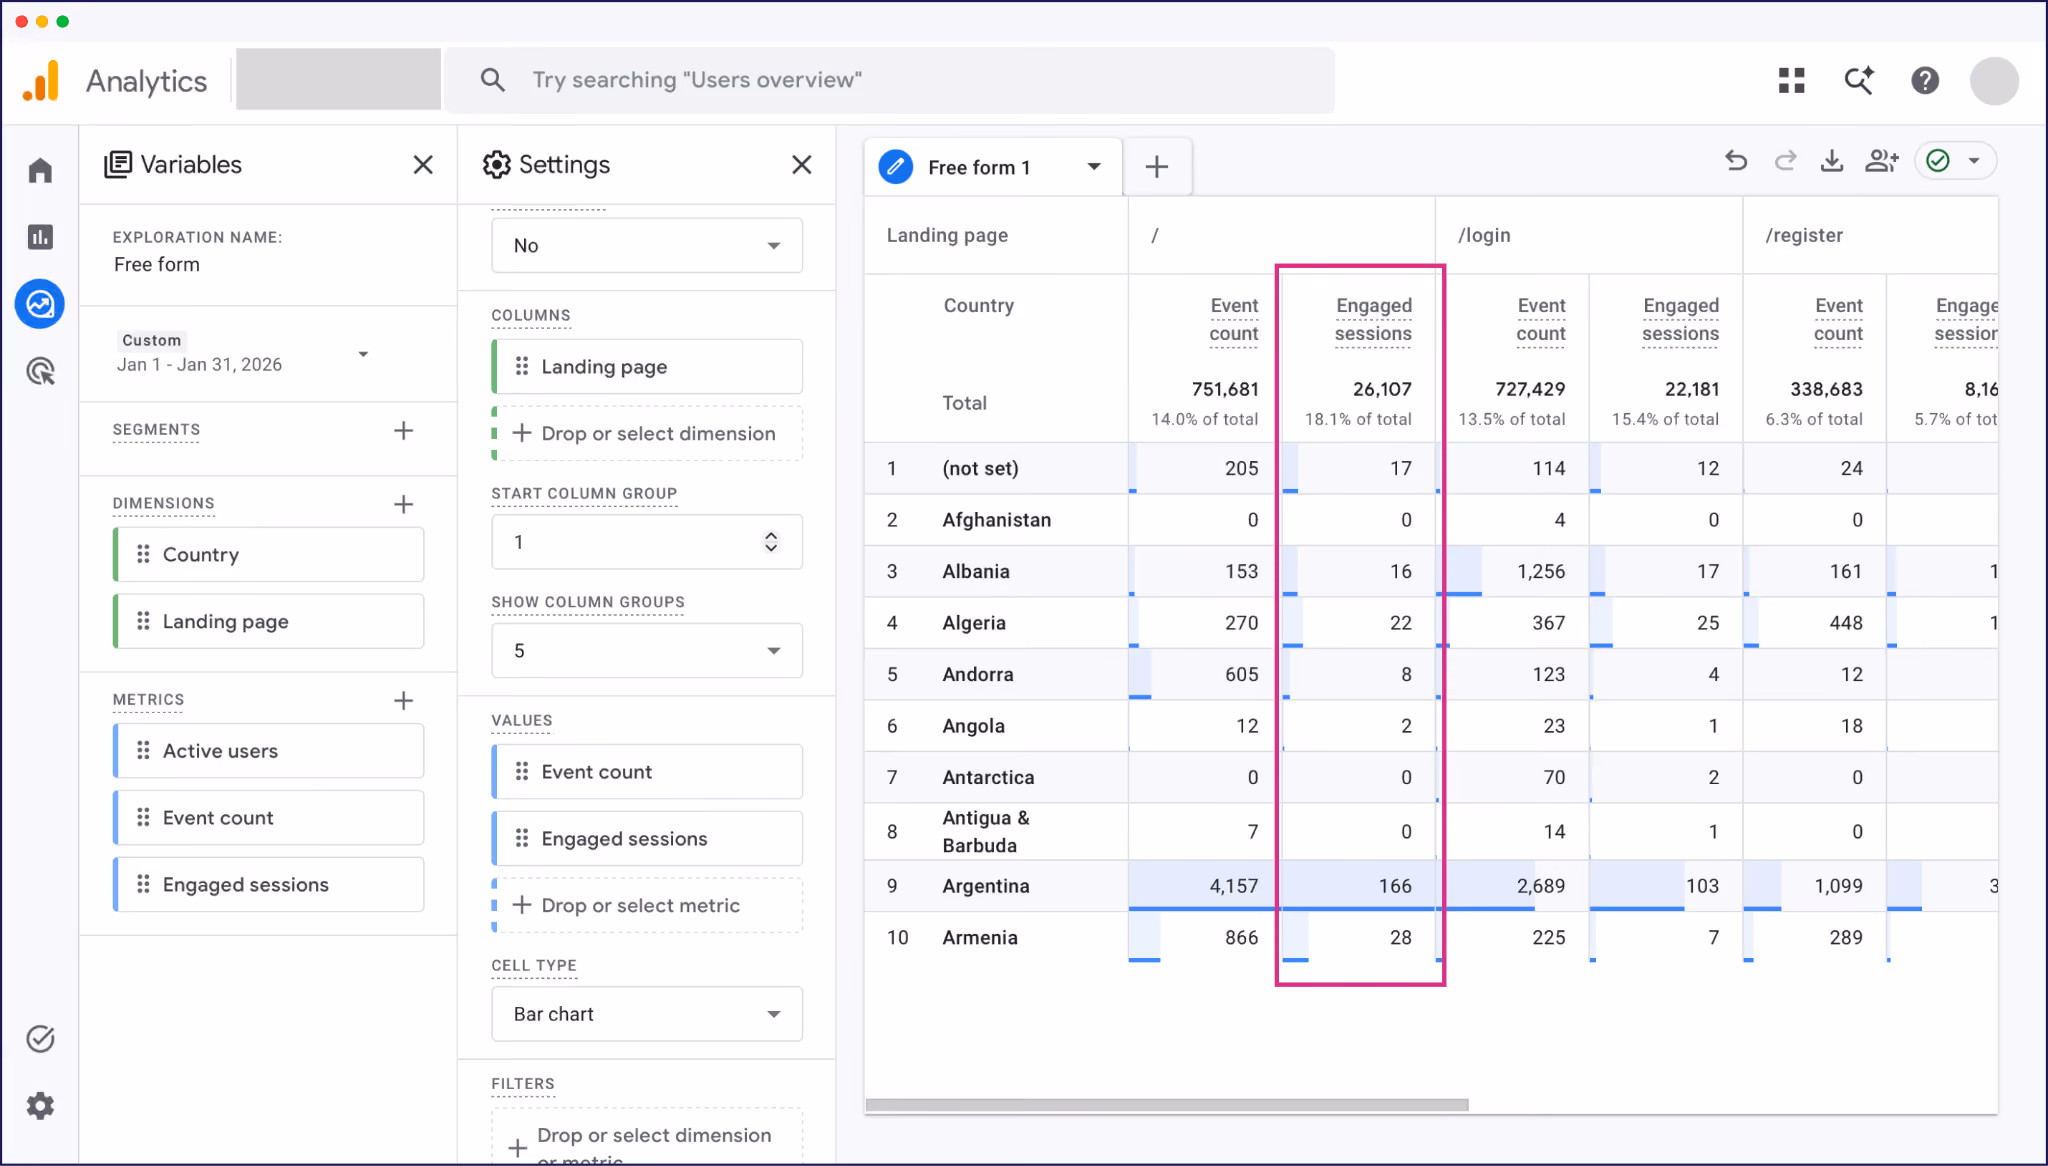
If engagement is high but conversions (or “Key events”) are low, that’s usually a localization signal. The content is doing its job and the friction is probably happening later in the journey.
Comparing source-language performance against translated equivalents helps separate SEO issues from localization issues.
If your English /pricing page converts at 4% and your French /fr/pricing page converts at 1.2%, the gap probably isn’t SEO as you’re already getting the traffic.
More often, it points again to localization friction: translations that don’t read naturally, untranslated form fields and CTAs, currency or date formats that feel unfamiliar, or social proof that only resonates with the source market.
GA4 will give you all of this data, but it takes setup – custom dimensions, explorations, filters, and audiences per market. That’s time spent building reports before you can even analyze performance or take action.
Weglot’s Dashboard shows per-language page view statistics by default.
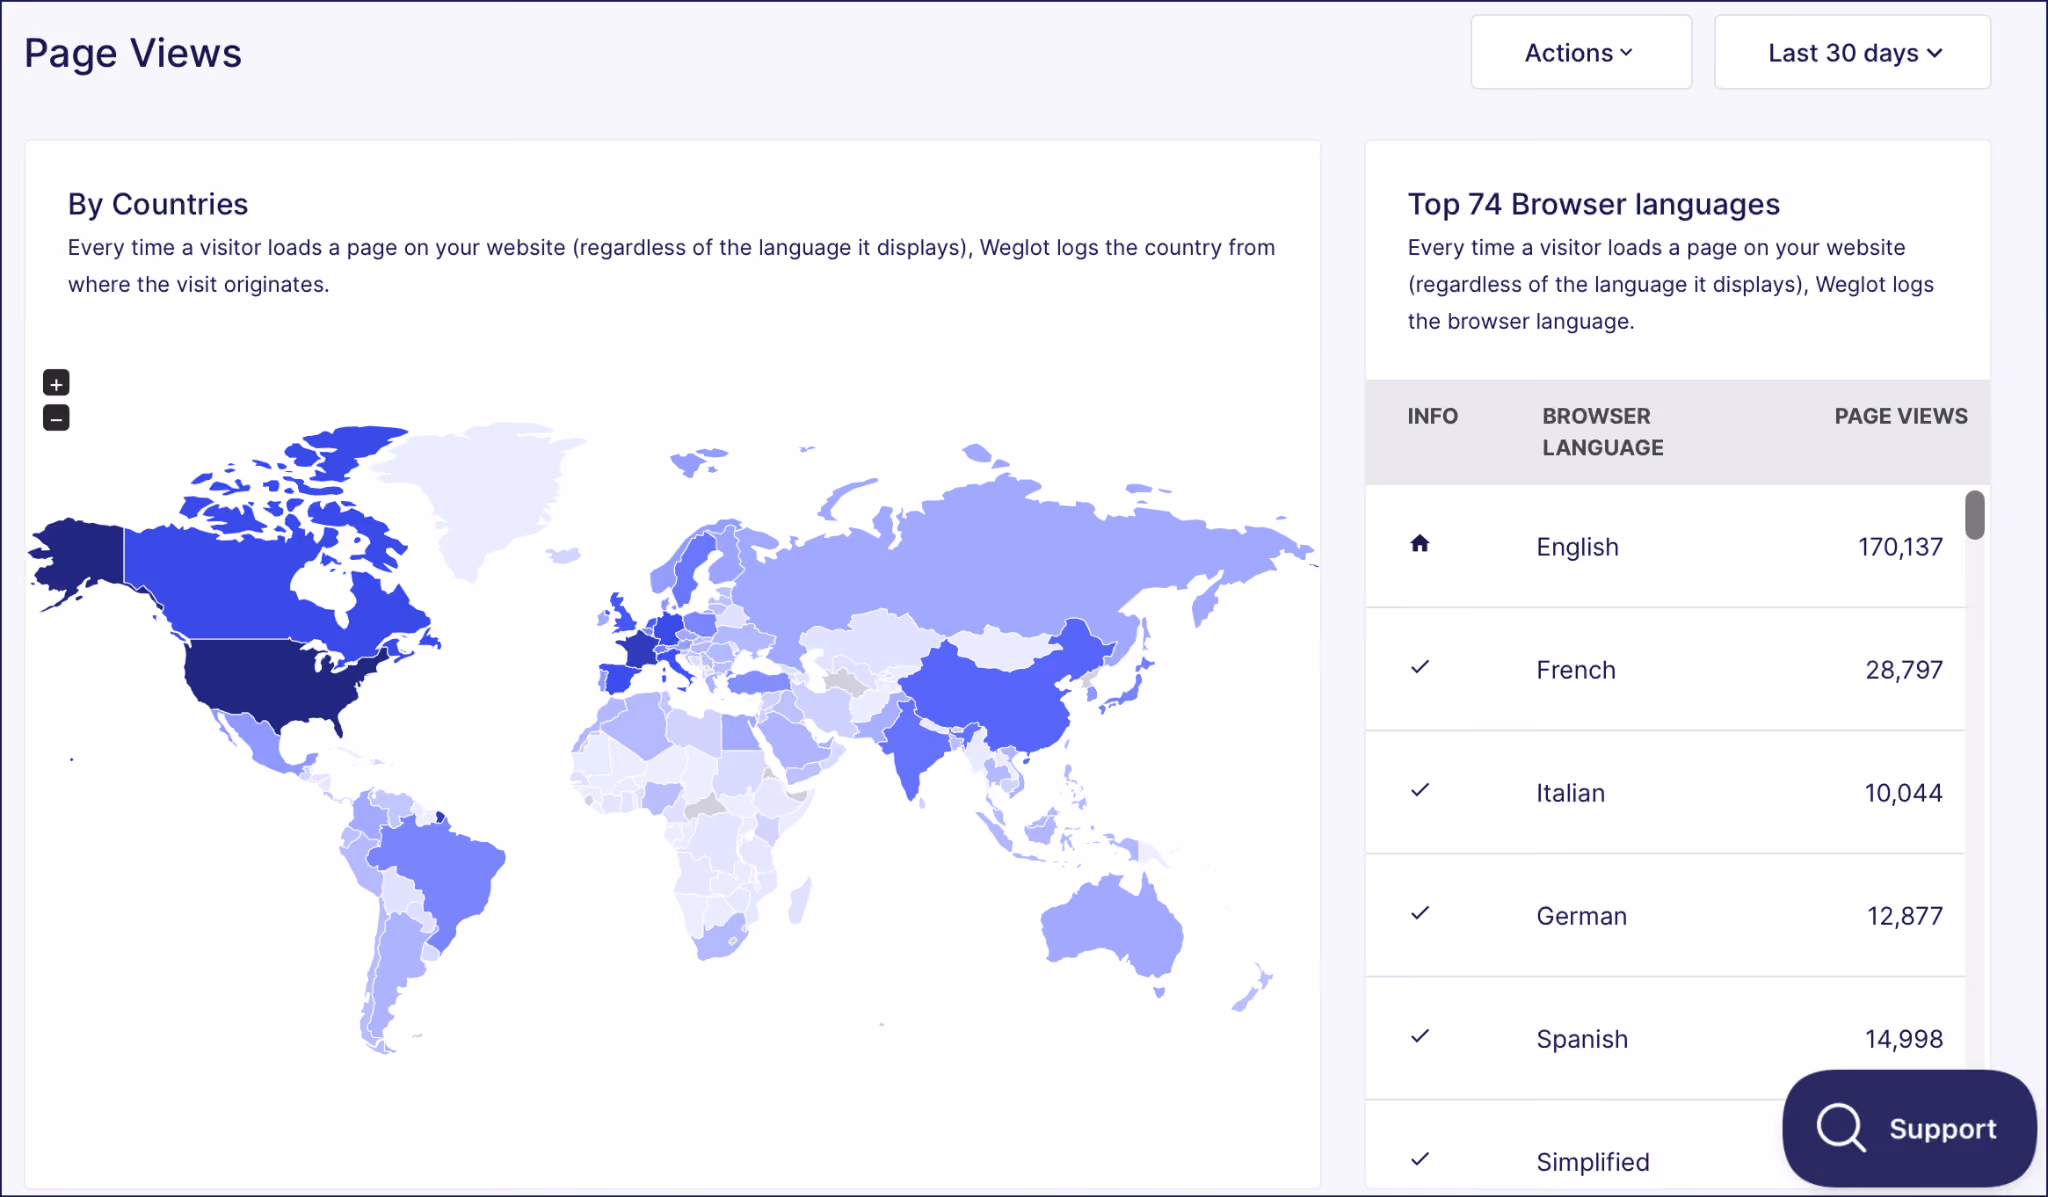
It won’t replace GA4 for deep diagnostics, but for the day-to-day question of “how is each language version performing?”, Weglot’s Page Views data is a much faster read.
If Tiers 1 and 2 are about traditional search, Tier 3 is the new layer many marketing teams haven’t started measuring: how often your site gets cited in AI Overviews and by GenAI tools.
Translated sites have a measurable, sizable edge in this space.
We analyzed 1.3 million citations across Google AI Overviews and ChatGPT, comparing translated and untranslated sites in Spanish-language markets.
What we learned was that translated sites gained 327% more visibility in AI Overviews when users searched in languages the site didn’t previously support.
There are a few reasons that gap is so big:
For more on how AI search treats language, our multilingual GEO guide breaks down the platform-by-platform differences.
A category of dedicated AI visibility tools is emerging fast: Profound, AirOps, Otterly AI, plus AI modules being added to Ahrefs and Semrush.
Those are worth a look if AI search is already a board-level priority and the budget is there.
But for most teams starting out, manual sampling is the realistic first step. Here’s the simple way to do it:
Find out how your website currently performs across languages and get a detailed report on your international visibility.
The visibility gap will keep widening as AI search grows.
Brands investing in multilingual content now are building AI search authority in markets where competitors are locked out. Their competitors who wait will spend the next year or two trying to close a gap that has compounded against them.
If you’re already translated, AI search visibility is a metric worth adding to your monthly reporting, even if the manual method isn’t quite as smooth as just checking a dashboard.
If you’re not translated, it’s a strong argument for prioritizing it.
GA4 and GSC already have the data you need. The setup work is in knowing which reports to build and which defaults to filter past.
The highest-leverage move in this section. In GA4, go to Admin → Property → Search Console Links and connect your verified GSC property.
Once linked, you’ll see query data (from GSC) alongside landing page behavior (from GA4) in the same report. Then you can stop flipping between two tools to answer one question.
For multilingual sites, the payoff is bigger: you can see which French queries drive traffic to which French landing pages, and what those visitors do once they arrive.
But remember, none of this works if your translated pages aren’t properly indexed and structured. Clean URLs, working hreflang, and translated metadata are the prerequisites that make the data trustworthy.
Different tiers deserve different cadences. Checking every metric every week usually creates noise. Here’s a simpler way to manage your tracking, using the datapoints and reports we’ve already covered.
Ultimately, weekly catches problems before they compound, monthly tells you what’s working, and quarterly tells you whether your multilingual strategy is positioned for where search is heading.
Every metric in this guide assumes your site is properly translated, indexable, and structured for multilingual SEO. Hreflang, clean URLs, translated metadata, and language-specific subdirectories – the foundation the measurement framework sits on.
If that’s already in place, pick the tier that matches your current reporting maturity and start measuring properly.
If it’s not, that’s the work to prioritize first. Weglot handles the multilingual SEO infrastructure automatically: hreflang tags, translated metadata, language-specific URLs, all synced with your source site.
For a quick read on what international expansion could look like for your site, try our International Growth Calculator. It’s a low-commitment way to size up new market opportunities. Then translate the markets that matter using Weglot’s 14-day free trial.

We’ll get your first languages live. You decide how far you want to go. Try Weglot for free today.
Trusted by 70,000+ global brands


Weglot is tested and trusted by brands worldwide since 2016. Join them today.


The best way to understand the power of Weglot is to see it for yourself. Test it for free and without any engagement.
A demo website is available in your dashboard if you’re not ready to connect your website yet.